

December 18, 2019
In November the Teranet–National Bank National Composite House Price Index™ was up 0.2% from the previous month. This was a good showing for a month of November – in seven of the last 10 Novembers, the index has declined (The last quarter of the year is typically a seasonal slow period). If purely seasonal variations were taken out, the resulting seasonally adjusted index would show a fourth consecutive monthly increase.
The composite index was braked in November by declines of the indexes for Halifax (−1.3%) and Winnipeg (−0.6%). The indexes for Toronto, Victoria and Ottawa-Gatineau about flat. The remaining six indexes were up: Edmonton 0.1%, Calgary 0.2%, Montreal 0.3%, Vancouver 0.4%, Hamilton 0.4%, Quebec City 1.0%. For Vancouver it was a second consecutive gain after a run of 15 months without one. Home sales in that market have recovered from a March bottom to the average volume of the last 10 years. The index for Toronto remains below its September peak. Its flatness coincides with a plateauing of home sales, not necessarily worrisome given that this market is balanced. The most sustained performer has been the Montreal urban area, whose index has risen in 17 of the last 20 months. However, its cumulative gain of 11.0% over that period is topped by the 15.4% of the index for Ottawa.
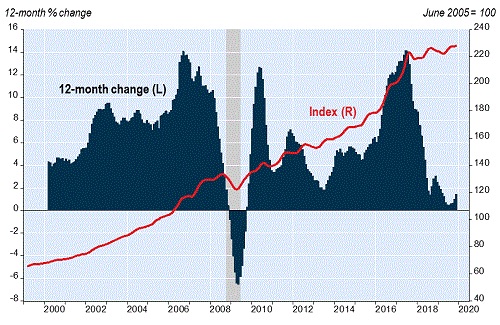
The composite index has been strengthening for seven months after weakness in the previous eight, a path reflected in a cumulative gain of only 1.4% over the 12 months ending in November. That, however, amounts to a fourth consecutive acceleration. The 12-month gain of the composite index was braked by the three largest western markets – Vancouver (down 5.2% from a year earlier), Edmonton (−2.7%) and Calgary (−0.9%). The change from a year earlier was marginally upward for Winnipeg (0.2%), Victoria (0.7%) and Quebec City (0.9%), more firmly upward in Toronto (4.2%), Hamilton (5.0%), Montréal (6.4%), Halifax (6.8%) and Ottawa-Gatineau (8.1%).
Besides the Toronto and Hamilton indexes included in the composite index, indexes exist for the seven other urban areas of the Golden Horseshoe. In general, the 12-month movement of these indexes has been quite similar to those of Toronto and Hamilton – recoveries beginning in the second quarter of the year after a period of weakness. All seven were up from a year earlier, some strongly: Oshawa 2.9%, Barrie 3.2%, Peterborough 7.0%, Kitchener 7.4%, St. Catharines 7.6%, Guelph 8.0%, Brantford 8.2%.
Indexes not included in the composite index also exist for seven markets outside the Golden Horseshoe. Of the two in B.C., Abbotsford-Mission has been reviving for three months after struggling over the previous nine, for a 12-month retreat of 1.7%, while Kelowna has been recovering for eight months and is up 3.4% from a year earlier. Of the five in Ontario, Windsor (+9.4%) and London (+9.4%) have done well over the whole 12-month period. The up-and-down path of Thunder Bay left it up 4.4% from a year earlier. Spectacular recoveries over the seven months ending in November left Kingston up 7.4% and Sudbury up 4.8% from a year earlier.
For the full report, including historical data, please visit www.housepriceindex.ca.