

June 19, 2019
In May the Teranet–National Bank National Composite House Price IndexTM was up 0.5% from the month before,[1] the first monthly gain in nine months. On the other hand, for a month of May it was the smallest rise in 21 years of index history. If seasonally adjusted, the index would have been down 0.4% on the month. Unadjusted indexes were up on the month for nine of the 11 metropolitan markets of the composite index, the exceptions being Vancouver (−0.2%) and Edmonton (−0.3%). Calgary was up 0.3%, Winnipeg 0.5%, Toronto 0.7% and Victoria 0.7%, but indexes for these four markets were down when seasonally adjusted. Index changes for Montreal (+0.5%), Quebec City (+0.8%), Halifax (+0.9%), Ottawa-Gatineau (+1.9%) and Hamilton (+2.2%) would have remained positive after seasonal adjustment.
For Vancouver it was a 10th straight month without a rise. If the index was purged from seasonal variation, the number of consecutive months without a rise ranged from 17 for Calgary to three for Toronto and Winnipeg. The index for Victoria would have declined in three of the last four months. So, when seasonal variations are taken apart, zones of weakness subsist. The latest news, however, is encouraging on this point. The Canadian Real Estate Association reports that seasonally adjusted home sales were up strongly in May in Vancouver, Toronto, Calgary and Winnipeg. More generally, the housing market is favoured by fundamentals including declining interest rates and the strength of the labour market.
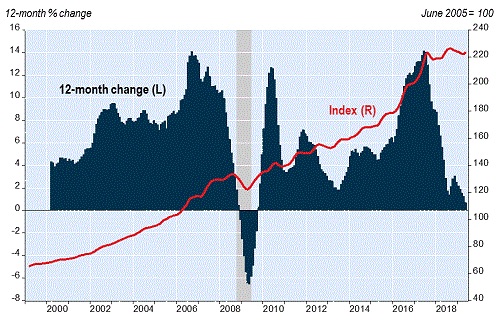
The recent weakness of indexes for several markets is reflected in the 12-month advance of the composite index, which at 0.7% in May was the smallest since November 2009. The 12-month change was pulled down by the markets of western Canada: Vancouver (down 4.1% from a year earlier), Victoria (−0.4%), Calgary (−3.2%), Edmonton (−1.1%) and Winnipeg (−1.5%). The 12-month change was positive for Halifax (2.1%), Quebec City (2.1%), Toronto (2.6%) and, signalling vigorous markets, Hamilton (5.1%), Montreal (5.3%) and Ottawa-Gatineau (6.1%).
Besides the Toronto and Hamilton indexes included in the composite index, indexes exist for seven other urban areas of the Golden Horseshoe. In May, the downtrend since August noted in our previous reports was fading after recent months of recovery. Only four of these indexes were still down from August and not by much: Brantford (−0.1%), Peterborough (−0.1%), Guelph (−0.6%) and Oshawa (−0.9%). Barrie was up 0.3% over the nine months, St. Catharines 0.5% and Kitchener 1.7%.
Indexes not included in the composite index also exist for seven markets outside the Golden Horseshoe. Down from nine months ago were the two in B.C. – Abbotsford-Mission (−5.2%) and Kelowna (−3.6%). Up were the five in Ontario – Thunder Bay (1.6%), Sudbury (2.9%), London (4.0%), Kingston (4.2%) and Windsor (6.8%).
For the full report including historical data, please visit www.housepriceindex.ca.