 October 20, 2020
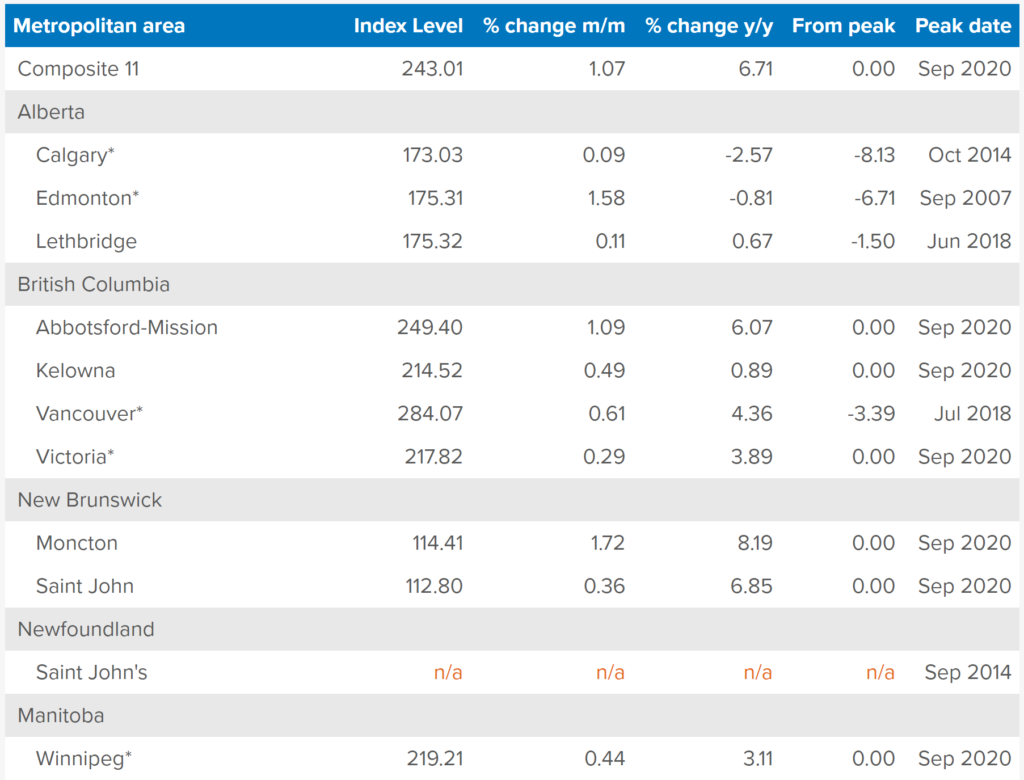
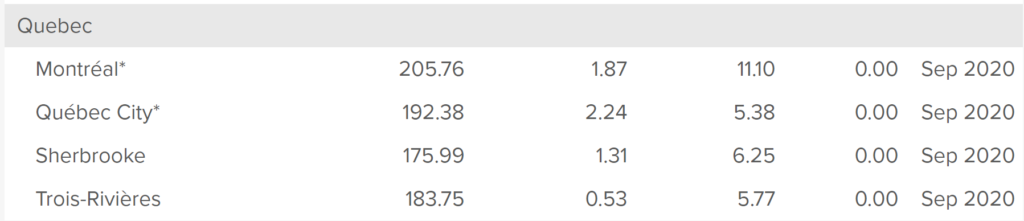
In September the Teranet–National Bank National Composite House Price IndexTM was up 1.1% from the previous month, the second-biggest gain for a month of September in the 22 years of the composite index. The rise was led by Ottawa-Gatineau (2.3%), Quebec City (2.2%), Montreal (1.9%), Hamilton (1.9%), Edmonton (1.6%), Toronto (1.0%), Halifax (1.0%) and Vancouver (0.6%). There were respectable monthly increases for Winnipeg (0.4%) and Victoria (0.3%). Calgary edged up 0.1%.
Another sign of firming markets is that for the first time since May, the number of sale pairs entering into the 11 metropolitan indexes was higher than a year earlier, and by no less than 29%. This development echoes the revival of home sales reported by the Canadian Real Estate Association beginning in July, recovering ground lost in the severe slowdowns of previous months due to Covid-19. The unsmoothed composite index, seasonally adjusted, was up 1.2% in September, suggesting that the uptrend of the published (smoothed) index could persist.
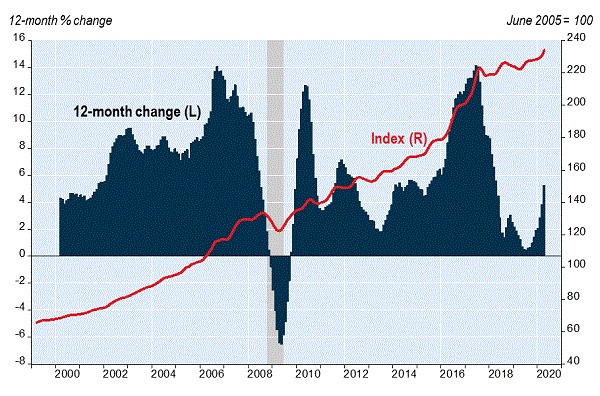
The September composite index was up 6.7% from a year earlier, an acceleration from August. The 12-month gain was led by Ottawa-Gatineau (14.3%), Halifax (12.2%), Montreal (11.1%), Hamilton (10.4%) and Toronto (8.3%). Lagging the countrywide average were Quebec City (5.4%), Vancouver (4.4%), Victoria (3.9%) and Winnipeg (3.1%). Down from 12 months earlier were Edmonton (−0.8%) and Calgary (−2.6%).
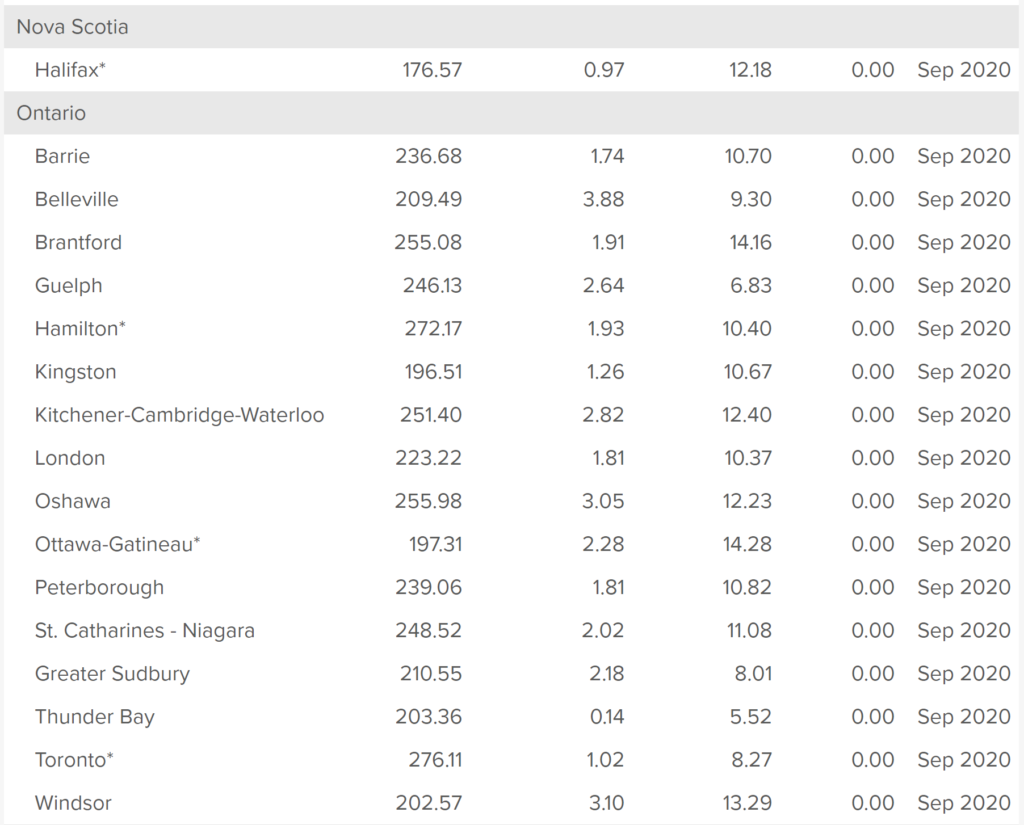
Besides the Toronto and Hamilton indexes included in the countrywide composite, indexes exist for seven other urban areas of the Golden Horseshoe – Barrie, Guelph, Brantford, Kitchener, St. Catharines, Oshawa and Peterborough. All seven of these indexes were up from the previous month and from a year earlier. The 12-month gains ranged from 6.8% for Guelph to 14.2% for Brantford.
Indexes not included in the composite index also exist for 13 markets outside the Golden Horseshoe. Seven of them are in provinces other than Ontario: Abbotsford-Mission and Kelowna, B.C.; Lethbridge, Alberta; Trois-Rivières and Sherbrooke, Quebec; and Moncton and Saint John, N.B. (a province, incidentally, with a record number of home sales). The September indexes for all seven markets were up from the previous month and from a year earlier. The 12-month gains ranged from 0.7% in Lethbridge to 8.2% in Moncton.
The other six markets are in Ontario outside the Golden Horseshoe: London, Kingston, Belleville, Windsor, Thunder Bay and Sudbury. The September smoothed indexes for all six were up from the previous month and from a year earlier. The 12-month advances ranged from 5.5% in Thunder Bay to 10.7% in Kingston.
As the table at the end of this report shows, the indexes for all of the 31 metropolitan markets surveyed were up in the month of September. It was the first month of across-the-board monthly gains in the whole period for which we have indexes for each of these 31 markets, i.e. since 2009.
To download the full report, please visit our website: https://housepriceindex.ca/2020/10/september2020/