

September 19, 2019
In August the Teranet–National Bank National Composite House Price IndexTM was up 0.4% from the month before. As in the three previous months, the gain was below the 21-year average for the month, 0.7% in the case of August. In contrast to May, June and July, however, the August index would have been up slightly if seasonally adjusted. In other words, the recent run of months that showed an underlying downtrend after correction for seasonal pressure has come to an end.
Over the last four months, the composite index has been braked by a continuing decline of the index for Vancouver and the flatness of the index for Edmonton. In August indexes were down for Vancouver (−0.8%), Edmonton (−0.1%) and Quebec City (−0.4%). For Vancouver it was a 13th month without a rise, for Edmonton a third in four months. For Quebec City, on the other hand, it was a first decline after three consecutive monthly rises. The seven other markets of the composite index were all up on the month: Victoria 0.2%, Calgary 0.6%, Hamilton 0.7%, Winnipeg 0.7%, Toronto 0.8%, Montreal 1.1%, Ottawa-Gatineau 1.7% and Halifax 1.8%. For Toronto, Hamilton, Ottawa-Gatineau and Victoria it was a fifth consecutive rise, for Montreal, Winnipeg and Halifax a fourth.
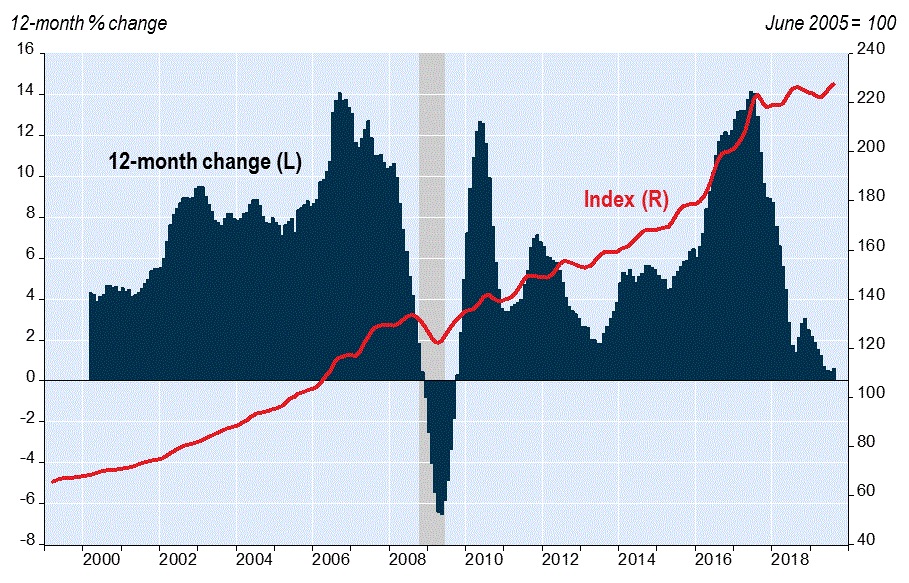
The prior weakness of indexes for several markets is reflected in the 12-month rise in the composite index, which at 0.6% in August was small but nevertheless an acceleration, for the first time in nine months. That rise was held down by the largest markets of Western Canada – Vancouver down 6.6% from a year earlier, Edmonton down 3.1%, and Calgary down 2.3%. There were slight 12-month gains for Quebec City (0.1%), Victoria (0.7%) and Winnipeg (1.1%). The gains were larger for Toronto (3.8%), Hamilton (4.4%), Halifax (5.5%), Montreal (5.7%) and Ottawa-Gatineau (6.4%).
Besides the Toronto and Hamilton indexes included in the composite index, indexes exist for the seven other large urban areas of the Golden Horseshoe. The indexes for these markets have generally risen sharply over the last six months after a downtrend over the previous six months and now are all up from a year earlier, some of them strongly: Oshawa 1.7%, Brantford 3.0%, Barrie 3.7%, Peterborough 5.0%, Guelph 5.1%, Kitchener 5.8%, St. Catharines 6.6%.
Indexes not included in the composite index also exist for seven markets outside the Golden Horseshoe. Of the two in B.C., Abbotsford-Mission has been struggling over the last 12 months, declining 5.0%, and Kelowna has recovered in the last five months for a rise of 0.1% from a year earlier. Of the five others, all in Ontario, the 12-month gains were in double digits for Windsor (11.4%) and London (10.1%). The indexes for Kingston, Sudbury and Thunder Bay have recently recovered strongly to end the 12 months with respective rises of 9.3%, 4.8% and 4.3%.
For the full report including historical data, please visit www.housepriceindex.ca.