

April 12, 2019
The Composite Index down for a sixth month in a row in March
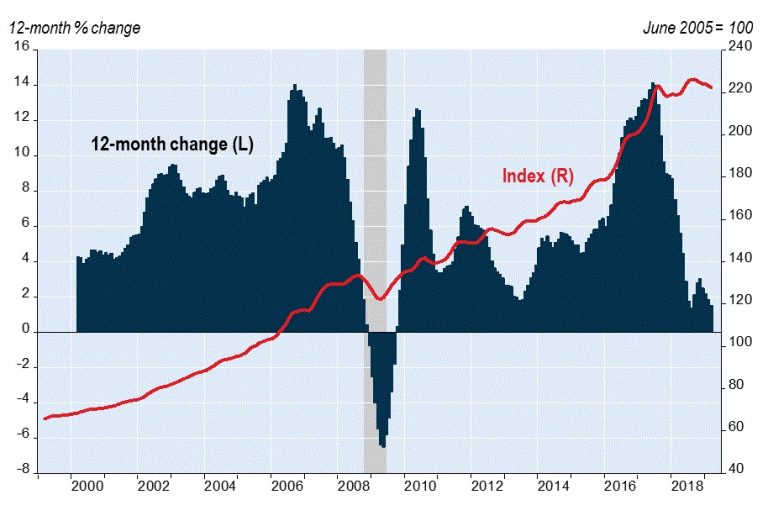
In March the Teranet–National Bank National Composite House Price IndexTM was down 0.3% from the previous month.[1] Apart from the recession year 2009, it was the first March decline in the 20 years of index history. It was also the sixth consecutive monthly decline, for a cumulative drop of 1.7%. Indexes were down on the month for seven of the 11 metropolitan markets surveyed – Ottawa-Gatineau (−1.5%), Victoria (−1.1%), Vancouver (−0.5%), Calgary (−0.5%), Toronto (−0.3%), Winnipeg (−0.3%) and Hamilton (−0.1%). Four markets were up: Halifax (0.8%), Quebec City (0.5%), Edmonton (0.4%) and Montreal (0.1%).
Most of the markets in the composite index have been trending down for months. For Calgary it was the ninth straight month without a rise (cumulative decline 3.7%), for Vancouver the eighth (cumulative −4.3%), for Victoria the sixth (−3.5%). The March rise of the Edmonton index had been preceded by six consecutive months without a rise (cumulative −3.2% over the seven months). Indexes for Winnipeg, Hamilton and Ottawa-Gatineau each retreated in all but one of the last six months (cumulative −2.2%, −2.4% and 2.3% respectively). The Toronto index has fallen in five of the last seven months (cumulative −0.2%). These markets are all in striking contrast with Montreal, which has declined in only one of the last 12 months (cumulative +5.5%). The Halifax index has advanced in each of the last five months (cumulative +2.0%).
Teranet-National Bank National Composite House Price Index™
Despite the recent downtrends, only two markets are down from a year earlier – Calgary (−2.8%) and Vancouver (−2.1%). For Edmonton the 12-month gain was 0.1%, for Winnipeg 0.5%, for Victoria 0.7%, for Halifax 3.0%, for Hamilton 3.2%, for Toronto 3.3%, for Quebec City 3.9%, for Ottawa-Gatineau 5.2%, for Montreal 5.5%. The composite index was up 1.5% from a year earlier.
Besides the Toronto and Hamilton indexes included in the composite, indexes exist for seven other urban areas of the Golden Horseshoe. They are trending down like the indexes for Toronto, Hamilton and Ottawa-Gatineau. Guelph is down 0.4% from six months earlier, Kitchener −0.5%, Peterborough −0.8%, Oshawa −0.9%, St. Catharines −2.3% and Brantford −2.4%. The index for Barrie is up a marginal 0.1%.
Indexes not included in the composite index also exist for seven markets outside the Golden Horseshoe, five in Ontario and two in B.C. In March, four of these were down from six months earlier – Kelowna (−4.8%), Abbotsford-Mission (−3.8%), Sudbury (−2.8%) and Thunder Bay (−2.4%). The index for Kingston was flat. Windsor was up 1.8% from six months earlier, London 1.9%.
For the full report including historical data, please visit www.housepriceindex.ca.