
July 20, 2020
In June the Teranet–National Bank National Composite House Price IndexTM was up 0.7% from the month before, a rise half the average for June over the previous 10 years and the lowest June advance in 17 years. And if the index were corrected for seasonal pressures (seasonal adjustment), it would show a slight decline of 0.1% in June, a first retreat in 11 months.
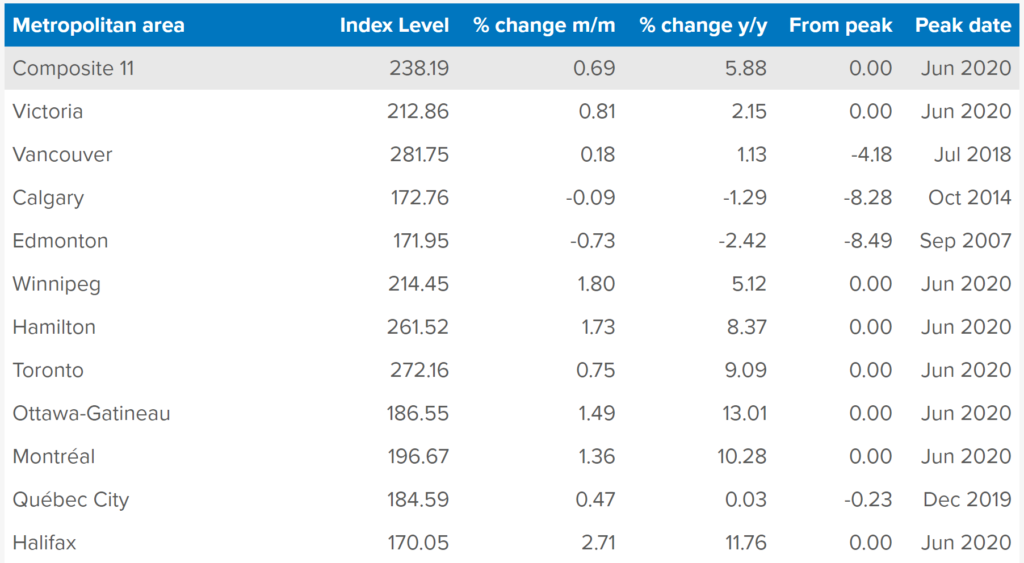
The index was led upward by Halifax (2.7%), Winnipeg (1.8%), Hamilton (1.7%), Ottawa-Gatineau (1.5%), Montreal (1.4%), Toronto (0.8%) and Victoria (0.8%). Trailing the countrywide average advance were Quebec City (0.5%) and Vancouver (0.2%). Prices were down on the month in Calgary (−0.1%) and Edmonton (−0.7%).
Other signs confirm the slowing of the market. First, in the wake of actions to stem the spread of Covid-19, the number of repeat sales entering into the index was down 24% from June 2019, a second straight large drop from a year earlier. This drop is the reflection in the public land registries of the slowing of unit sales that began in the second half of March and extended into May. Second, after correction for seasonal fluctuation (seasonal adjustment), the raw composite index for June was down 1.1% on the month and the raw indexes for six of the 11 markets of the national composite index were flat or down from the previous month.
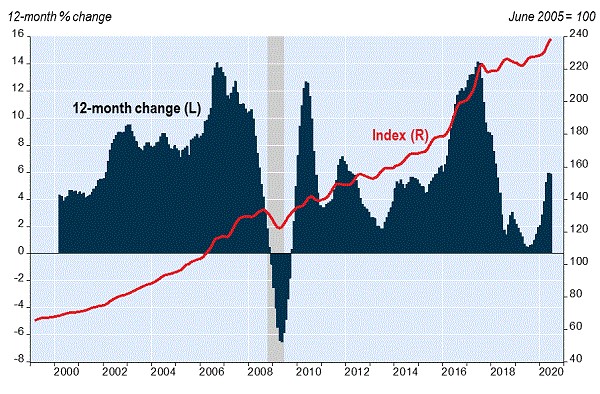
In June the composite index was up 5.9% from a year earlier, a slight deceleration of the 12-month gain after 10 months of acceleration. The 12-month rise was led by the indexes for Ottawa-Gatineau (13.0%), Halifax (11.8%), Montreal (10.3%), Toronto (9.1%) and Hamilton (8.4%). Lagging the countrywide average were Winnipeg (5.1%), Victoria (2.1%), and Vancouver (1.1%). The index for Quebec City was flat from a year earlier. Deflating over the 12 months were Calgary (−1.3%) and Edmonton (−2.4%).
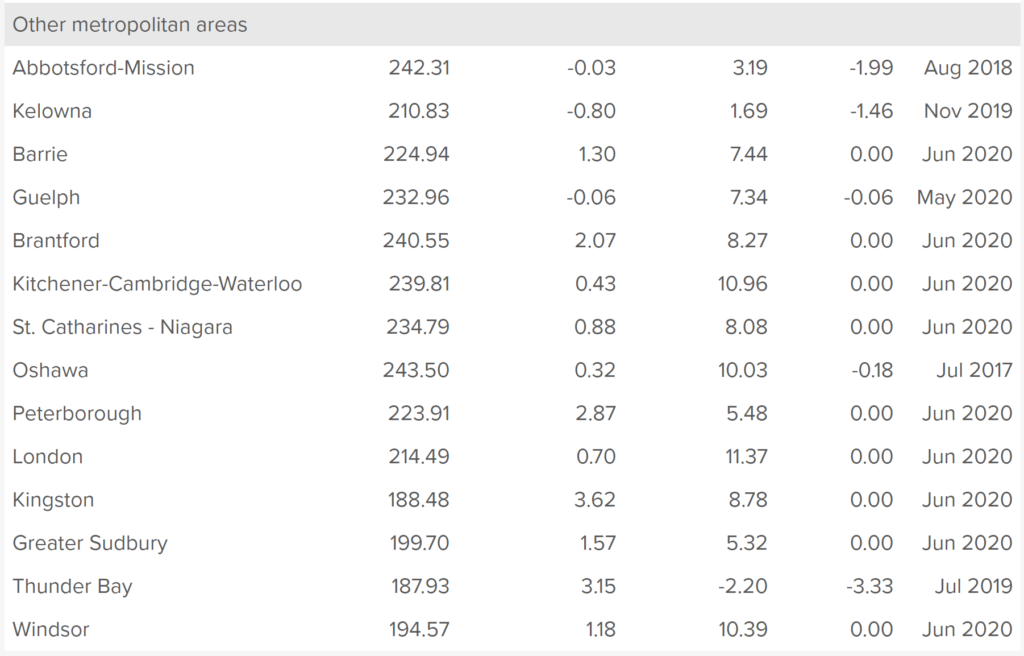
Besides the Toronto and Hamilton indexes included in the composite index, indexes exist for seven other urban areas of the Golden Horseshoe: Barrie, Guelph, Brantford, Kitchener, St. Catharines, Oshawa and Peterborough. As in May, the number of repeat sales was down on a year-over-year basis in six of them, by as much as 41% in the case of Peterborough. The table below presents the monthly and 12-month changes of the smoothed indexes for these markets. We note, however, that the seasonally adjusted raw indexes (not shown in the table) were down in June for Guelph, Brantford, St. Catharines, Kitchener and Oshawa, though not for Barrie and Peterborough.
Indexes not included in the composite index also exist for seven markets outside the Golden Horseshoe. Of the two in B.C., repeat sales were down sharply in both Abbotsford-Mission and Kelowna and the seasonally adjusted raw index was down for Kelowna. Repeat sales were also down sharply in all of the five markets in Ontario – London, Kingston, Windsor, Thunder Bay and Sudbury. The seasonally adjusted raw indexes were down for Windsor and London.
For the full report, including historical data, please visit www.housepriceindex.ca.