

April 20, 2020
In March the Teranet–National Bank National Composite House Price Index™ was up 0.6% from the previous month. As was the case in February, this was double the average March rise of the last 10 years. Leading the advance were the markets of Ottawa-Gatineau (1.1%), Vancouver (1.0%) and Toronto (0.9%). Trailing the countrywide average were rises for Hamilton (0.4%), Quebec City (0.3%), Montreal (0.2%) and Halifax (0.1%). The index for Victoria was essentially flat. Down from the previous month were Calgary (−0.1%), Edmonton (−0.6%) and Winnipeg (−0.8%).
The index for Vancouver has now gone six months without a decline. Its previous run of 14 straight months without a rise seems to be definitely over, especially since the Vancouver resale market has returned to balance as measured by ratio of listings to sales. The index for Victoria has move little over the last seven months. Weakness persists in the Prairies: the indexes for Calgary and Winnipeg have declined in five of the last six months, that for Edmonton in four. In central and eastern Canada the story is different. The index for Ottawa-Gatineau has not declined in any of the last 12 months, that for Toronto in only one and those for Montreal, Hamilton and Halifax in two. All of these last five markets were at a historical peak in March.
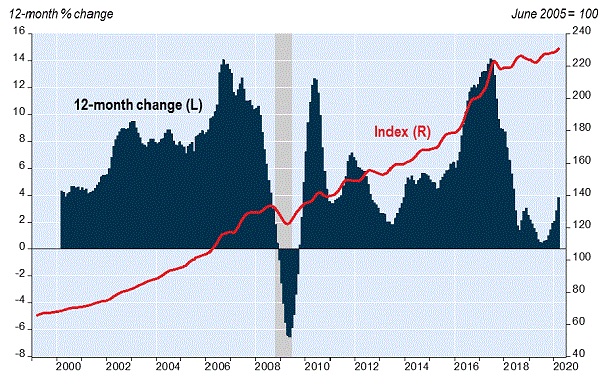
In March the composite index was up 3.8% from a year earlier, for an eighth consecutive acceleration of the 12-month gain to its strongest since June 2018. The 12-month rise was led by Ottawa-Gatineau (11.6%), Hamilton (8.5%), Montreal (7.5%), Toronto (6.4%) and Halifax (6.3%). Lagging the countrywide average were Victoria (3.6%) and Winnipeg (0.3%). Deflating over the 12 months were Vancouver (−0.7%), Quebec City (−0.7%), Calgary (−1.3%) and Edmonton (−2.7%).
Besides the Toronto and Hamilton indexes included in the composite index, indexes exist for seven other urban areas of the Golden Horseshoe. Some of them began the last 12 months with spectacular surges followed by doldrums – Peterborough (up 2.8% from a year earlier), Barrie (3.8%), Guelph (6.8%) and St. Catharines (6.8%). The 12-month paths of the other three were more regular, with Oshawa gaining 5.0%, Brantford 8.4% and Kitchener 10.3%.
Indexes not included in the composite index also exist for seven markets outside the Golden Horseshoe. Of the two in B.C., Abbotsford-Mission has been struggling and its index in March was down 1.3% from a year earlier, while Kelowna (+5.6%) did well last spring and summer before losing ground in recent months. Of the five in Ontario, Thunder Bay has declined in the last seven months and by March was down 2.3% from a year earlier. Sudbury (+4.8%) and London (+8.0%) surged early in the 12-month period and then flattened in the last six months. The paths of the indexes for Windsor (+11.8%) and Kingston (+9.2%) have been more regular.
For the full report, including historical data, please visit www.housepriceindex.ca.